
 Yahoo Finanzas
 Investors in BioSyent (CVE:RX) have seen returns of 21% over the past year
These days it's easy to simply buy an index fund, and your returns should (roughly) match the market. But investors can boost returns by picking market-beating companies to own shares in. For example, the BioSyent Inc. (CVE:RX) share price is up 18% in the last 1 year, clearly besting the market decline of around 0.5% (not including dividends). So that should have shareholders smiling. Looking back further, the share price is 15% higher than it was three years ago.
So let's investigate and see if the longer term performance of the company has been in line with the underlying business' progress.
View our latest analysis for BioSyent
To paraphrase Benjamin Graham: Over the short term the market is a voting machine, but over the long term it's a weighing machine. One imperfect but simple way to consider how the market perception of a company has shifted is to compare the change in the earnings per share (EPS) with the share price movement.
During the last year, BioSyent actually saw its earnings per share drop 14%.
So we don't think that investors are paying too much attention to EPS. Therefore, it seems likely that investors are putting more weight on metrics other than EPS, at the moment.
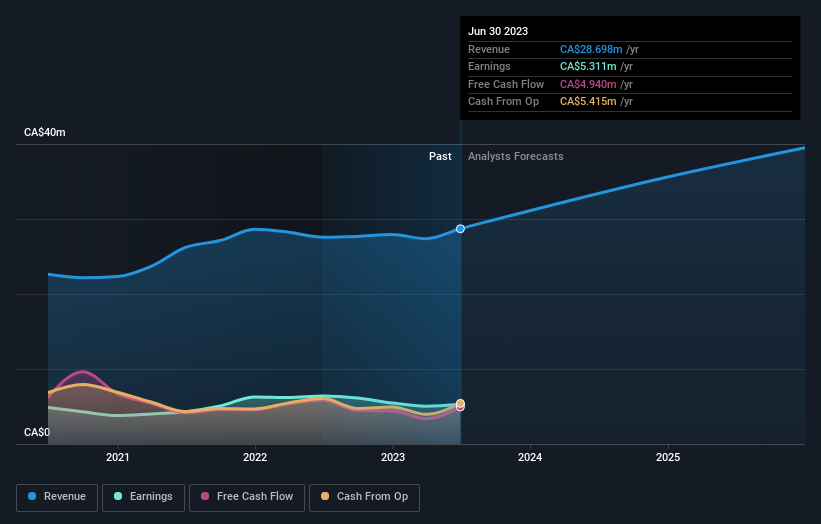
We think that the revenue growth of 4.1% could have some investors interested. We do see some companies suppress earnings in order to accelerate revenue growth.
You can see how earnings and revenue have changed over time in the image below (click on the chart to see the exact values).
This free interactive report on BioSyent's balance sheet strength is a great place to start, if you want to investigate the stock further.
What About Dividends?
It is important to consider the total shareholder return, as well as the share price return, for any given stock. The TSR is a return calculation that accounts for the value of cash dividends (assuming that any dividend received was reinvested) and the calculated value of any discounted capital raisings and spin-offs. Arguably, the TSR gives a more comprehensive picture of the return generated by a stock. In the case of BioSyent, it has a TSR of 21% for the last 1 year. That exceeds its share price return that we previously mentioned. This is largely a result of its dividend payments!
A Different Perspective
We're pleased to report that BioSyent shareholders have received a total shareholder return of 21% over one year. Of course, that includes the dividend. There's no doubt those recent returns are much better than the TSR loss of 2% per year over five years. We generally put more weight on the long term performance over the short term, but the recent improvement could hint at a (positive) inflection point within the business. It's always interesting to track share price performance over the longer term. But to understand BioSyent better, we need to consider many other factors. Even so, be aware that BioSyent is showing 1 warning sign in our investment analysis , you should know about...
If you would prefer to check out another company -- one with potentially superior financials -- then do not miss this free list of companies that have proven they can grow earnings.
Please note, the market returns quoted in this article reflect the market weighted average returns of stocks that currently trade on Canadian exchanges.
Have feedback on this article? Concerned about the content? Get in touch with us directly. Alternatively, email editorial-team (at) simplywallst.com.
This article by Simply Wall St is general in nature. We provide commentary based on historical data and analyst forecasts only using an unbiased methodology and our articles are not intended to be financial advice. It does not constitute a recommendation to buy or sell any stock, and does not take account of your objectives, or your financial situation. We aim to bring you long-term focused analysis driven by fundamental data. Note that our analysis may not factor in the latest price-sensitive company announcements or qualitative material. Simply Wall St has no position in any stocks mentioned.
