
 Yahoo Finanzas
 Investors in T&G Global (NZSE:TGG) have unfortunately lost 33% over the last five years
Ideally, your overall portfolio should beat the market average. But the main game is to find enough winners to more than offset the losers So we wouldn't blame long term T&G Global Limited (NZSE:TGG) shareholders for doubting their decision to hold, with the stock down 37% over a half decade. And we doubt long term believers are the only worried holders, since the stock price has declined 29% over the last twelve months.
It's worthwhile assessing if the company's economics have been moving in lockstep with these underwhelming shareholder returns, or if there is some disparity between the two. So let's do just that.
Check out our latest analysis for T&G Global
There is no denying that markets are sometimes efficient, but prices do not always reflect underlying business performance. One flawed but reasonable way to assess how sentiment around a company has changed is to compare the earnings per share (EPS) with the share price.
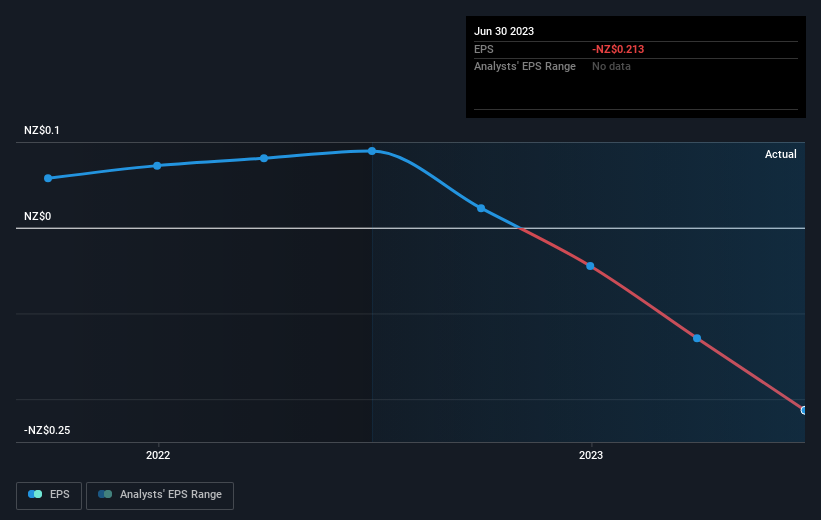
Over five years T&G Global's earnings per share dropped significantly, falling to a loss, with the share price also lower. Since the company has fallen to a loss making position, it's hard to compare the change in EPS with the share price change. However, we can say we'd expect to see a falling share price in this scenario.
You can see below how EPS has changed over time (discover the exact values by clicking on the image).
This free interactive report on T&G Global's earnings, revenue and cash flow is a great place to start, if you want to investigate the stock further.
What About The Total Shareholder Return (TSR)?
We've already covered T&G Global's share price action, but we should also mention its total shareholder return (TSR). The TSR attempts to capture the value of dividends (as if they were reinvested) as well as any spin-offs or discounted capital raisings offered to shareholders. Dividends have been really beneficial for T&G Global shareholders, and that cash payout explains why its total shareholder loss of 33%, over the last 5 years, isn't as bad as the share price return.
A Different Perspective
While the broader market lost about 2.8% in the twelve months, T&G Global shareholders did even worse, losing 29%. Having said that, it's inevitable that some stocks will be oversold in a falling market. The key is to keep your eyes on the fundamental developments. Regrettably, last year's performance caps off a bad run, with the shareholders facing a total loss of 6% per year over five years. Generally speaking long term share price weakness can be a bad sign, though contrarian investors might want to research the stock in hope of a turnaround. I find it very interesting to look at share price over the long term as a proxy for business performance. But to truly gain insight, we need to consider other information, too. Consider for instance, the ever-present spectre of investment risk. We've identified 1 warning sign with T&G Global , and understanding them should be part of your investment process.
Of course T&G Global may not be the best stock to buy. So you may wish to see this free collection of growth stocks.
Please note, the market returns quoted in this article reflect the market weighted average returns of stocks that currently trade on New Zealander exchanges.
Have feedback on this article? Concerned about the content? Get in touch with us directly. Alternatively, email editorial-team (at) simplywallst.com.
This article by Simply Wall St is general in nature. We provide commentary based on historical data and analyst forecasts only using an unbiased methodology and our articles are not intended to be financial advice. It does not constitute a recommendation to buy or sell any stock, and does not take account of your objectives, or your financial situation. We aim to bring you long-term focused analysis driven by fundamental data. Note that our analysis may not factor in the latest price-sensitive company announcements or qualitative material. Simply Wall St has no position in any stocks mentioned.
