
 Yahoo Finanzas
 Tandy Leather Factory (NASDAQ:TLF) Has Some Difficulty Using Its Capital Effectively
If you're looking at a mature business that's past the growth phase, what are some of the underlying trends that pop up? Typically, we'll see the trend of both return on capital employed (ROCE) declining and this usually coincides with a decreasing amount of capital employed. This indicates the company is producing less profit from its investments and its total assets are decreasing. So after we looked into Tandy Leather Factory (NASDAQ:TLF), the trends above didn't look too great.
Return On Capital Employed (ROCE): What Is It?
For those that aren't sure what ROCE is, it measures the amount of pre-tax profits a company can generate from the capital employed in its business. To calculate this metric for Tandy Leather Factory, this is the formula:
Return on Capital Employed = Earnings Before Interest and Tax (EBIT) ÷ (Total Assets - Current Liabilities)
0.049 = US$3.0m ÷ (US$69m - US$7.6m) (Based on the trailing twelve months to September 2023).
Thus, Tandy Leather Factory has an ROCE of 4.9%. Ultimately, that's a low return and it under-performs the Specialty Retail industry average of 12%.
See our latest analysis for Tandy Leather Factory
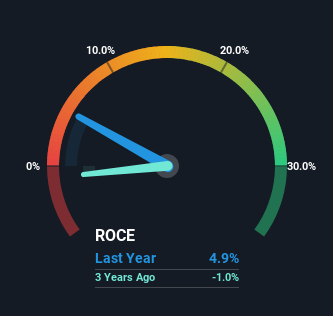
Historical performance is a great place to start when researching a stock so above you can see the gauge for Tandy Leather Factory's ROCE against it's prior returns. If you'd like to look at how Tandy Leather Factory has performed in the past in other metrics, you can view this free graph of past earnings, revenue and cash flow.
The Trend Of ROCE
There is reason to be cautious about Tandy Leather Factory, given the returns are trending downwards. About five years ago, returns on capital were 9.7%, however they're now substantially lower than that as we saw above. On top of that, it's worth noting that the amount of capital employed within the business has remained relatively steady. This combination can be indicative of a mature business that still has areas to deploy capital, but the returns received aren't as high due potentially to new competition or smaller margins. So because these trends aren't typically conducive to creating a multi-bagger, we wouldn't hold our breath on Tandy Leather Factory becoming one if things continue as they have.
Our Take On Tandy Leather Factory's ROCE
In the end, the trend of lower returns on the same amount of capital isn't typically an indication that we're looking at a growth stock. Long term shareholders who've owned the stock over the last five years have experienced a 23% depreciation in their investment, so it appears the market might not like these trends either. That being the case, unless the underlying trends revert to a more positive trajectory, we'd consider looking elsewhere.
One more thing, we've spotted 1 warning sign facing Tandy Leather Factory that you might find interesting.
While Tandy Leather Factory isn't earning the highest return, check out this free list of companies that are earning high returns on equity with solid balance sheets.
Have feedback on this article? Concerned about the content? Get in touch with us directly. Alternatively, email editorial-team (at) simplywallst.com.
This article by Simply Wall St is general in nature. We provide commentary based on historical data and analyst forecasts only using an unbiased methodology and our articles are not intended to be financial advice. It does not constitute a recommendation to buy or sell any stock, and does not take account of your objectives, or your financial situation. We aim to bring you long-term focused analysis driven by fundamental data. Note that our analysis may not factor in the latest price-sensitive company announcements or qualitative material. Simply Wall St has no position in any stocks mentioned.
