
 Yahoo Finanzas
 We Like These Underlying Return On Capital Trends At Hiap Huat Holdings Berhad (KLSE:HHHCORP)
Did you know there are some financial metrics that can provide clues of a potential multi-bagger? Amongst other things, we'll want to see two things; firstly, a growing return on capital employed (ROCE) and secondly, an expansion in the company's amount of capital employed. Ultimately, this demonstrates that it's a business that is reinvesting profits at increasing rates of return. With that in mind, we've noticed some promising trends at Hiap Huat Holdings Berhad (KLSE:HHHCORP) so let's look a bit deeper.
Return On Capital Employed (ROCE): What Is It?
If you haven't worked with ROCE before, it measures the 'return' (pre-tax profit) a company generates from capital employed in its business. The formula for this calculation on Hiap Huat Holdings Berhad is:
Return on Capital Employed = Earnings Before Interest and Tax (EBIT) ÷ (Total Assets - Current Liabilities)
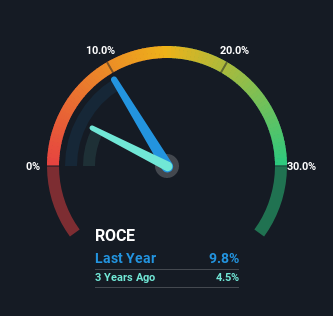
0.098 = RM11m ÷ (RM125m - RM8.0m) (Based on the trailing twelve months to December 2022).
Therefore, Hiap Huat Holdings Berhad has an ROCE of 9.8%. In absolute terms, that's a low return, but it's much better than the Commercial Services industry average of 7.4%.
View our latest analysis for Hiap Huat Holdings Berhad
While the past is not representative of the future, it can be helpful to know how a company has performed historically, which is why we have this chart above. If you're interested in investigating Hiap Huat Holdings Berhad's past further, check out this free graph of past earnings, revenue and cash flow.
What Can We Tell From Hiap Huat Holdings Berhad's ROCE Trend?
While in absolute terms it isn't a high ROCE, it's promising to see that it has been moving in the right direction. The numbers show that in the last five years, the returns generated on capital employed have grown considerably to 9.8%. Basically the business is earning more per dollar of capital invested and in addition to that, 65% more capital is being employed now too. The increasing returns on a growing amount of capital is common amongst multi-baggers and that's why we're impressed.
Our Take On Hiap Huat Holdings Berhad's ROCE
To sum it up, Hiap Huat Holdings Berhad has proven it can reinvest in the business and generate higher returns on that capital employed, which is terrific. Since the stock has returned a solid 47% to shareholders over the last five years, it's fair to say investors are beginning to recognize these changes. So given the stock has proven it has promising trends, it's worth researching the company further to see if these trends are likely to persist.
Hiap Huat Holdings Berhad does have some risks though, and we've spotted 2 warning signs for Hiap Huat Holdings Berhad that you might be interested in.
For those who like to invest in solid companies, check out this free list of companies with solid balance sheets and high returns on equity.
Have feedback on this article? Concerned about the content? Get in touch with us directly. Alternatively, email editorial-team (at) simplywallst.com.
This article by Simply Wall St is general in nature. We provide commentary based on historical data and analyst forecasts only using an unbiased methodology and our articles are not intended to be financial advice. It does not constitute a recommendation to buy or sell any stock, and does not take account of your objectives, or your financial situation. We aim to bring you long-term focused analysis driven by fundamental data. Note that our analysis may not factor in the latest price-sensitive company announcements or qualitative material. Simply Wall St has no position in any stocks mentioned.
Join A Paid User Research Session
You’ll receive a US$30 Amazon Gift card for 1 hour of your time while helping us build better investing tools for the individual investors like yourself. Sign up here
