
 Yahoo Finanzas
 Why We're Not Concerned About SOS Limited's (NYSE:SOS) Share Price
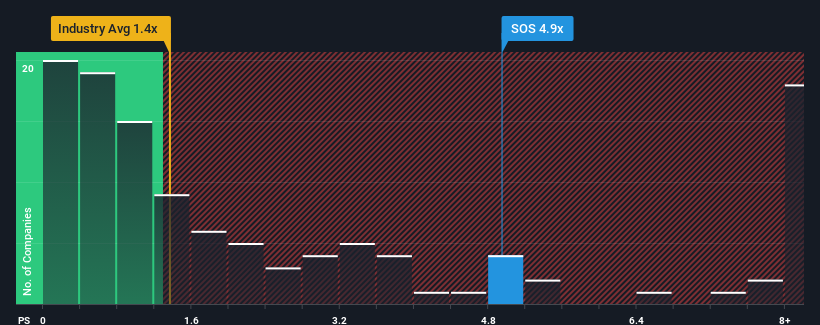
When close to half the companies in the Professional Services industry in the United States have price-to-sales ratios (or "P/S") below 1.4x, you may consider SOS Limited (NYSE:SOS) as a stock to avoid entirely with its 4.9x P/S ratio. However, the P/S might be quite high for a reason and it requires further investigation to determine if it's justified.
Check out our latest analysis for SOS
How Has SOS Performed Recently?
For instance, SOS' receding revenue in recent times would have to be some food for thought. One possibility is that the P/S is high because investors think the company will still do enough to outperform the broader industry in the near future. You'd really hope so, otherwise you're paying a pretty hefty price for no particular reason.
Want the full picture on earnings, revenue and cash flow for the company? Then our free report on SOS will help you shine a light on its historical performance.
How Is SOS' Revenue Growth Trending?
In order to justify its P/S ratio, SOS would need to produce outstanding growth that's well in excess of the industry.
In reviewing the last year of financials, we were disheartened to see the company's revenues fell to the tune of 11%. The latest three year period has seen an incredible overall rise in revenue, a stark contrast to the last 12 months. Therefore, it's fair to say the revenue growth recently has been superb for the company, but investors will want to ask why it is now in decline.
Comparing that to the industry, which is only predicted to deliver 7.0% growth in the next 12 months, the company's momentum is stronger based on recent medium-term annualised revenue results.
With this information, we can see why SOS is trading at such a high P/S compared to the industry. It seems most investors are expecting this strong growth to continue and are willing to pay more for the stock.
The Key Takeaway
It's argued the price-to-sales ratio is an inferior measure of value within certain industries, but it can be a powerful business sentiment indicator.
It's no surprise that SOS can support its high P/S given the strong revenue growth its experienced over the last three-year is superior to the current industry outlook. In the eyes of shareholders, the probability of a continued growth trajectory is great enough to prevent the P/S from pulling back. Unless the recent medium-term conditions change, they will continue to provide strong support to the share price.
There are also other vital risk factors to consider and we've discovered 2 warning signs for SOS (1 makes us a bit uncomfortable!) that you should be aware of before investing here.
If companies with solid past earnings growth is up your alley, you may wish to see this free collection of other companies with strong earnings growth and low P/E ratios.
Have feedback on this article? Concerned about the content? Get in touch with us directly. Alternatively, email editorial-team (at) simplywallst.com.
This article by Simply Wall St is general in nature. We provide commentary based on historical data and analyst forecasts only using an unbiased methodology and our articles are not intended to be financial advice. It does not constitute a recommendation to buy or sell any stock, and does not take account of your objectives, or your financial situation. We aim to bring you long-term focused analysis driven by fundamental data. Note that our analysis may not factor in the latest price-sensitive company announcements or qualitative material. Simply Wall St has no position in any stocks mentioned.
Join A Paid User Research Session
You’ll receive a US$30 Amazon Gift card for 1 hour of your time while helping us build better investing tools for the individual investors like yourself. Sign up here
