
 Yahoo Finanzas
 JHM Consolidation Berhad's (KLSE:JHM) Returns On Capital Not Reflecting Well On The Business
If you're not sure where to start when looking for the next multi-bagger, there are a few key trends you should keep an eye out for. In a perfect world, we'd like to see a company investing more capital into its business and ideally the returns earned from that capital are also increasing. If you see this, it typically means it's a company with a great business model and plenty of profitable reinvestment opportunities. In light of that, when we looked at JHM Consolidation Berhad (KLSE:JHM) and its ROCE trend, we weren't exactly thrilled.
Understanding Return On Capital Employed (ROCE)
If you haven't worked with ROCE before, it measures the 'return' (pre-tax profit) a company generates from capital employed in its business. Analysts use this formula to calculate it for JHM Consolidation Berhad:
Return on Capital Employed = Earnings Before Interest and Tax (EBIT) ÷ (Total Assets - Current Liabilities)
0.022 = RM7.8m ÷ (RM444m - RM90m) (Based on the trailing twelve months to March 2024).
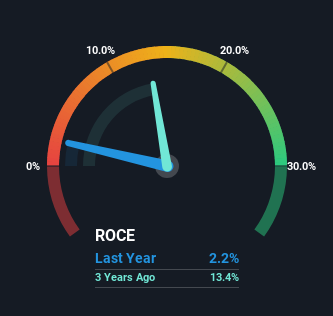
Thus, JHM Consolidation Berhad has an ROCE of 2.2%. Ultimately, that's a low return and it under-performs the Electronic industry average of 10%.
View our latest analysis for JHM Consolidation Berhad
Above you can see how the current ROCE for JHM Consolidation Berhad compares to its prior returns on capital, but there's only so much you can tell from the past. If you'd like to see what analysts are forecasting going forward, you should check out our free analyst report for JHM Consolidation Berhad .
What Does the ROCE Trend For JHM Consolidation Berhad Tell Us?
In terms of JHM Consolidation Berhad's historical ROCE movements, the trend isn't fantastic. Over the last five years, returns on capital have decreased to 2.2% from 21% five years ago. And considering revenue has dropped while employing more capital, we'd be cautious. If this were to continue, you might be looking at a company that is trying to reinvest for growth but is actually losing market share since sales haven't increased.
Our Take On JHM Consolidation Berhad's ROCE
From the above analysis, we find it rather worrisome that returns on capital and sales for JHM Consolidation Berhad have fallen, meanwhile the business is employing more capital than it was five years ago. It should come as no surprise then that the stock has fallen 45% over the last five years, so it looks like investors are recognizing these changes. Unless there is a shift to a more positive trajectory in these metrics, we would look elsewhere.
On a final note, we've found 2 warning signs for JHM Consolidation Berhad that we think you should be aware of.
For those who like to invest in solid companies, check out this free list of companies with solid balance sheets and high returns on equity.
Have feedback on this article? Concerned about the content? Get in touch with us directly. Alternatively, email editorial-team (at) simplywallst.com.
This article by Simply Wall St is general in nature. We provide commentary based on historical data and analyst forecasts only using an unbiased methodology and our articles are not intended to be financial advice. It does not constitute a recommendation to buy or sell any stock, and does not take account of your objectives, or your financial situation. We aim to bring you long-term focused analysis driven by fundamental data. Note that our analysis may not factor in the latest price-sensitive company announcements or qualitative material. Simply Wall St has no position in any stocks mentioned.
Have feedback on this article? Concerned about the content? Get in touch with us directly. Alternatively, email editorial-team@simplywallst.com
